
This lesson covers fluid dynamics, pipe flow, Reynolds number, laminar flow, and friction loss calculations for mechanical engineering beginners.
The Mission: Solving the Oil Pipe Puzzle
Imagine you are trying to drink a thick milkshake through a straw. It takes effort, right? You have to suck hard to get the shake into your mouth. That effort is you overcoming Pressure Loss.
In this lesson, we are going to calculate exactly how much pressure we lose when we push oil through a pipe system.
Here is our situation:
- We have oil flowing through a pipe.
- The pipe starts wide (
 ) and then gets narrower (
 ).
). - We need to find out how much energy (pressure) is lost due to friction.
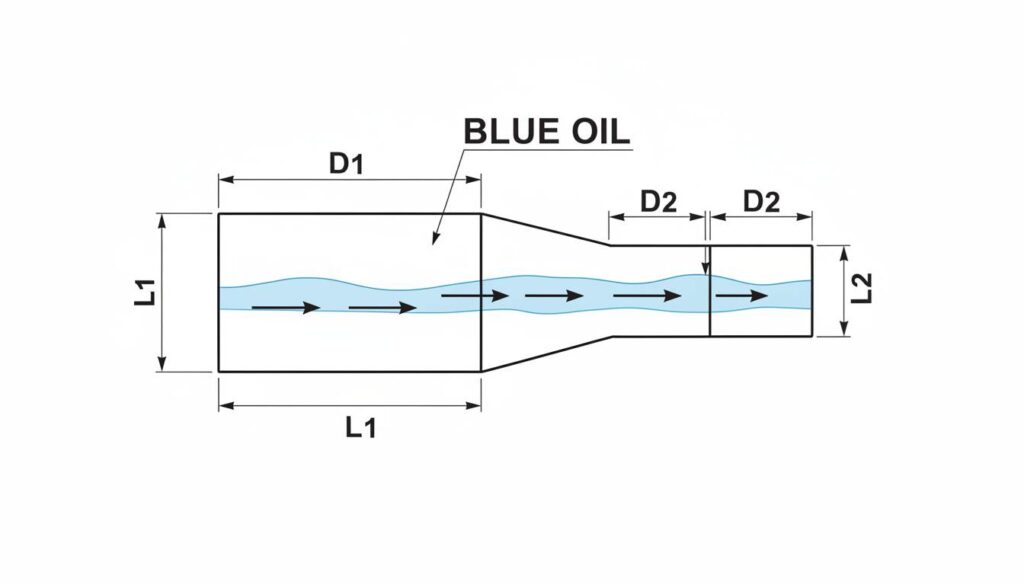
Technical Figure: A 2D engineering schematic of a horizontal pipe. The left section is wider (labeled D1, L1) and connects to a narrower right section (labeled D2, L2). Blue oil flows from left to right. Arrows indicate flow direction.
Why Do We Lose Pressure?
Think of the oil molecules rubbing against the walls of the pipe. This rubbing is Friction. Just like sliding on a carpet burns your knees, fluid sliding in a pipe creates friction. This friction steals energy from the flow, causing the pressure to drop.
If you switch from a wide straw to a very skinny coffee stirrer, does it become harder or easier to drink your drink? Why do you think the size of the “tunnel” matters?
Step 1: Getting Our Numbers Ready (Unit Conversion)
Engineers speak one language: SI Units (Meters, Kilograms, Seconds). Our problem gave us a mix of units. We must fix them first.
Given Data:
- Flow Rate (
 ): 10 Liters per minute.
 - Diameters (): 13 mm and 8 mm.
- Viscosity (
 ): 20 cSt (Centistokes).
 - Density (): 850 kg/m³.
Converting to Standard Units
- Flow Rate (
 ): We need cubic meters per second (
 ).
).
- 10 L/min divided by 1000 gives cubic meters.
- Divide by 60 gives seconds.
 .
.- Diameters (): We need meters.
 .
. .
.- Viscosity (
 ): We need square meters per second ().
- “cSt” stands for Centistokes. To get standard units, we divide by 1,000,000.
 .
.
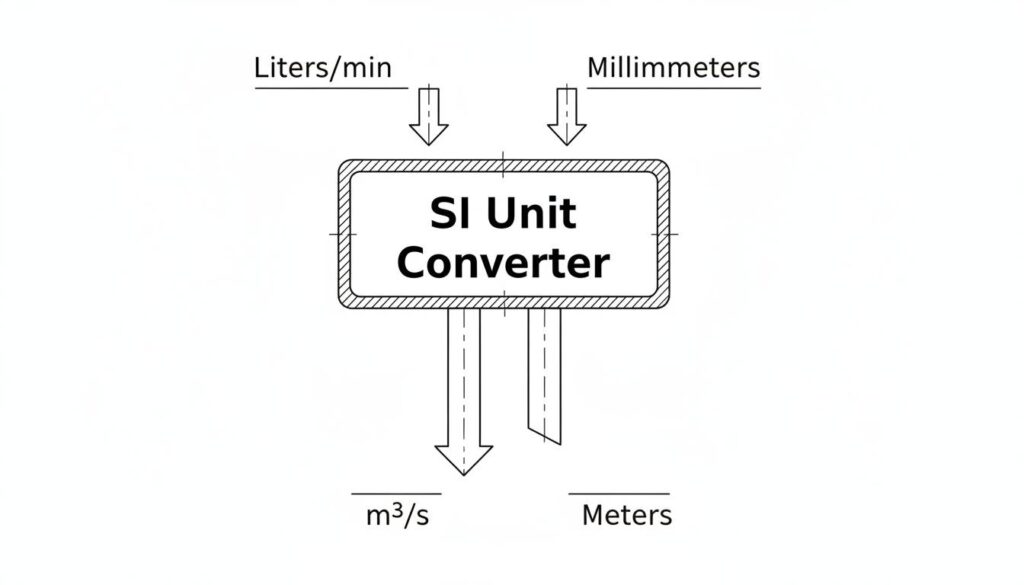
Technical Figure: An infographic showing a conversion funnel. Top shows ‘Liters/min’ and ‘Millimeters’. They pass through a filter labeled ‘SI Unit Converter’. The bottom shows ‘m³/s’ and ‘Meters’ coming out cleanly.
Step 2: How Fast is the Oil Moving? (Velocity)
We need to know the speed of the oil in both sections of the pipe.
The Rule: If the pipe gets smaller, the fluid must speed up to get through. Think of a wide river rushing through a narrow canyon.
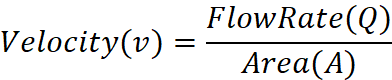
Formula:
Calculating Area ( )
)
First, we find the area of the circle for both pipes.

- Pipe 1 Area:

- Pipe 2 Area:

Calculating Velocity ( )
)
- Velocity in Pipe 1 (
 ):
):
- Velocity in Pipe 2 (
 ):
):

Notice: The oil is moving almost 3 times faster in the narrow pipe!
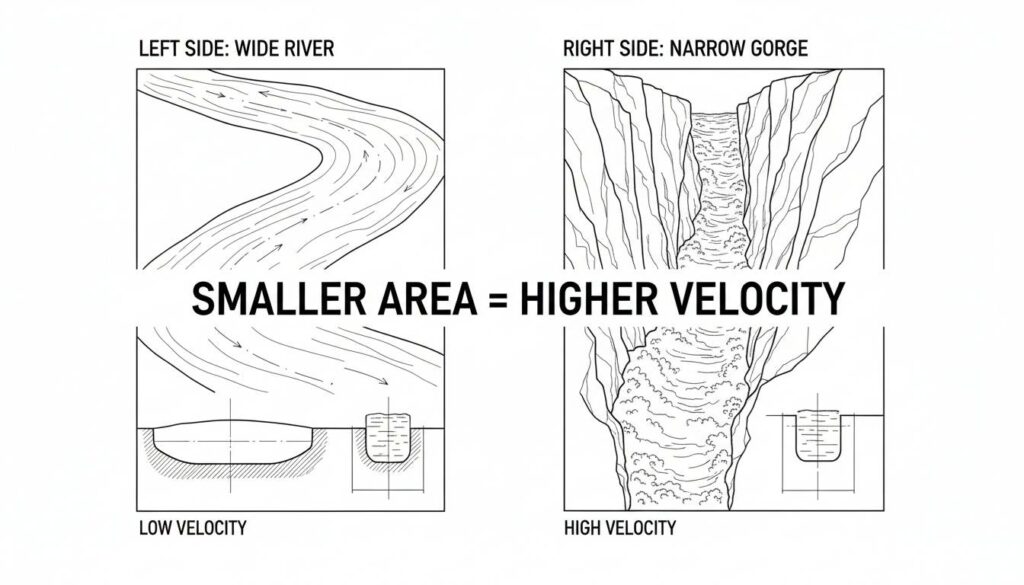
Technical Figure: A split screen comparison. Left side: A wide river moving slowly. Right side: The same river squeezed into a narrow gorge, moving very fast with white water. Text overlay: “Smaller Area = Higher Velocity”.
Since the oil is moving faster in the second pipe, do you think it is rubbing against the walls more violently or less violently? How might that change the friction?
Step 3: Is the Flow Smooth or Messy? (Reynolds Number)
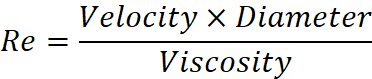
We need to know if the flow is Laminar (smooth, like honey) or Turbulent (chaotic, like a waterfall). We use a special number called the Reynolds Number ( ).
).
The Formula:
Checking Pipe 1

Checking Pipe 2

The Verdict
In pipes, if the Reynolds number is less than 2000, the flow is Laminar.
Both 819 and 1336 are less than 2000.
Great news! The flow is smooth (Laminar) in both pipes. This makes our math easier.
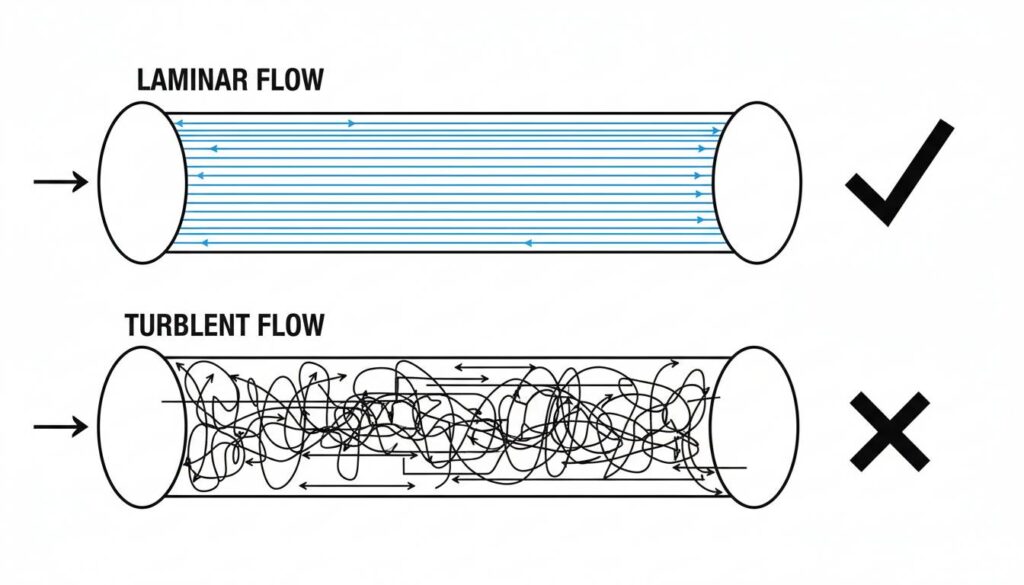
Technical Figure: Illustration of Laminar vs Turbulent flow inside a pipe. Top pipe shows blue streamlines moving perfectly straight and parallel (Laminar). Bottom pipe shows chaotic, swirling lines (Turbulent). A checkmark is placed next to the Laminar pipe.
Step 4: Calculating the Friction Factor
Because the flow is smooth (Laminar), calculating the “roughness” or friction factor ( ) is simple.
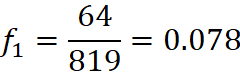
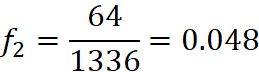
Formula for Laminar Flow:

- Friction Factor Pipe 1 (
 ):
):
- Friction Factor Pipe 2 (
 ):
):

Technical Figure: A cartoon magnifying glass looking at the inside wall of a pipe. It shows the fluid layers sliding over each other. A number counter next to it displays “f = 64/Re”.
Step 5: Calculating Pressure Loss
Now we put it all together to find the pressure loss ( ). We use the Darcy-Weisbach equation, but we will look at it simply:
Pressure Loss = Friction Pipe Length Energy of Speed
The Formula:

Loss in Pipe 1 (The Wide Pipe)





Loss in Pipe 2 (The Narrow Pipe)


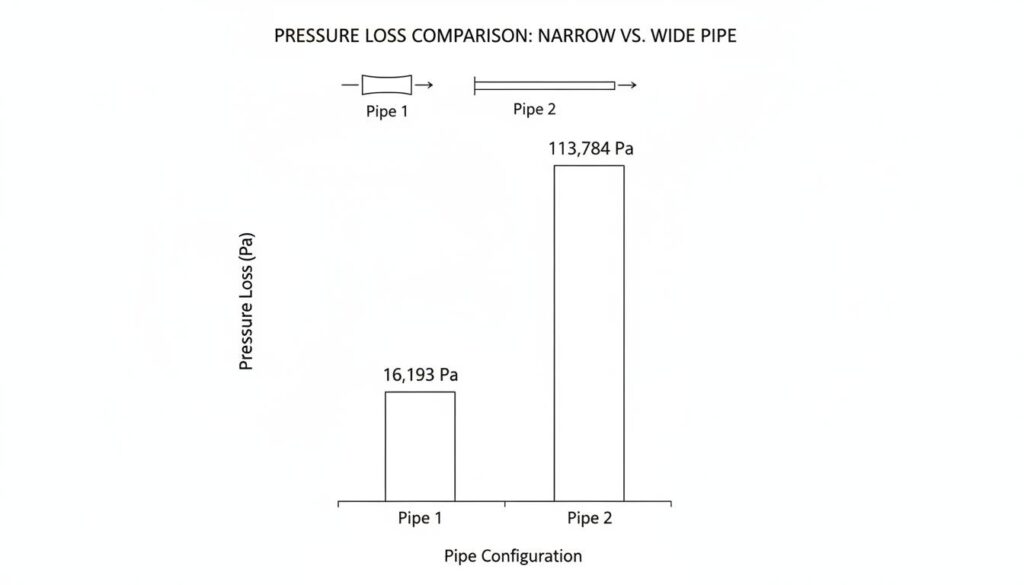
Technical Figure: A bar chart comparing pressure loss. The first bar (Pipe 1) is short and labeled “16,193 Pa”. The second bar (Pipe 2) is very tall, labeled “113,784 Pa”. This visually demonstrates how much more pressure is lost in the narrow pipe.
Conclusion: The Total Loss
To find the total pressure loss, we just add the two numbers together.

We can convert this to “Bars” to make it easier to read (1 Bar = 100,000 Pascals).
Total Pressure Loss  1.3 Bar.
Summary
Even though the pipes were the same length (4 meters), the narrow pipe lost almost 7 times more pressure than the wide pipe. This is because the oil had to move much faster, creating much more friction.
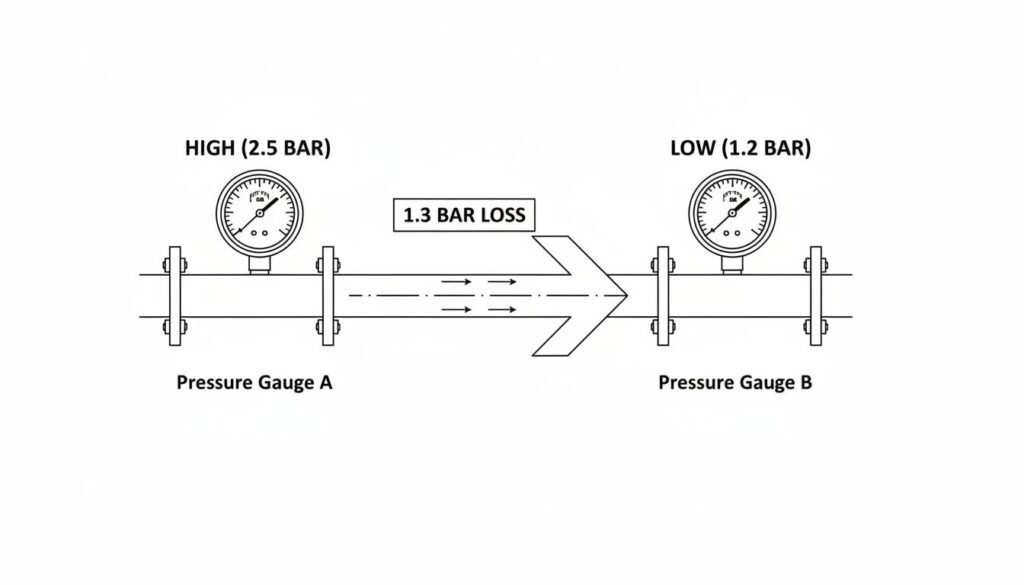
Technical Figure: A final summary image showing a pressure gauge at the start of the pipe reading “High” and a pressure gauge at the end reading “Low”. The difference between them is highlighted as “1.3 Bar Loss”.
If we wanted to reduce the pressure loss but keep the pipe length the same, what is the single most effective change we could make to the design? (Hint: Look at the difference between Pipe 1 and Pipe 2).
